The observant passer-by may have noticed the elegant white dome on the roof of building NW1 (Natural Sciences 1) in the Otto-Hahn-Allee. What goes on there? Does it house a planetarium, a telescope, or some other kind of mysterious astronomical gadgets?
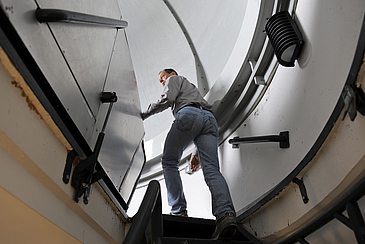
“Nothing really spectacular at all”, says Prof.Justus Notholt, leader of the “Remote Earth Sensing” research group at the Institute of Environmental Physics, leading the way onto a roof terrace with a breathtaking view over Bremen. We then proceed up a narrow spiral staircase. He presses a button, and a hatch door opens in the dome, rather like a UFO after landing. The (sun)light spills in, or what counts as such on this misty Bremen day. Another touch of a button, and the dome begins to turn on its axis before resting at the desired angle.
Playing ping-pong with rays of light
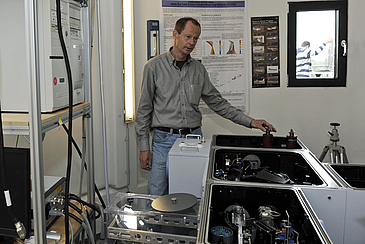
This is where the environmental physicist captures the sun’s rays. The mirrored device inside the dome is called a sun tracker. It was constructed in the mechanical workshop by the institute’s own technicians. “We spent ages fiddling around, adjusting the motors and mirrors”, says Notholt. They play a sort of ping-pong with the light beam before it is directed through a tube one level lower into the Fourier Transform Infrared Spectrometer (FTIR). This is not a home-made affair and has to be purchased. Once it enters the angular gray box of the spectrometer, the beam of light is split up. A total number of seven mirrors are needed to achieve the physical effect. One of these moves about agitatedly as though waiting for a starting signal; it then comes to rest, before suddenly shooting backwards and forwards on its rail. The device must be constantly purged with dry air; the detectors filled with liquid nitrogen. To ensure this runs smoothly and that the sun tracker is correctly adjusted, Notholt’s research assistants have “dome duty”.
Molecules leave fingerprints
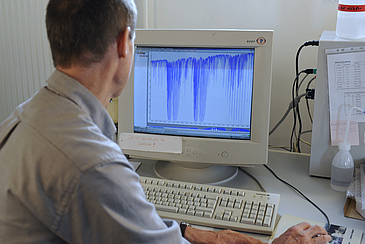
The spectrum is then depicted as a graphical curve on a computer display. This curve would be flat, if not for the fact that some of the sunlight is absorbed by the atmosphere; this causes ‘fissures’ to appear, producing a veritable staccato of lines – somewhat like an etching. “Every molecule leaves its fingerprint in the spectrum. Here we can see the CO2”, explains the environmental physicist. In this way we can measure the occurrence of 30 different trace gases at a range of up to 1,000 kilometers in the direction of the sun.
Besides the dome on top of building NW1, the “Remote Earth Sensing” research group operates additional spectrometers to measure trace gases and aerosols at other locations around the world. These, though, are housed in containers. One of the containers is located in Paramaribo, the capital of the South American Republic of Suriname; another in Bialystok, Poland. The collected data is then included in their calculations, together with those contributed by the research vessel ‘Polarstern’, which is run by the Alfred Wegener Institute in Bremerhaven, and from NyAlesund on Spitzbergen. International networks which the Bremen institute also belongs to then feed the results into large-scale data bases so that the information can be made available to other researchers at universities in the Netherlands, France, and the USA.
Experiment with an uncertain outcome
What can be gleaned from these measurements? In the course of the Earth’s history, over the past 500,000 years the CO2 concentration in the air increased by about 1 ppm (parts per million) every 200 years: it is now increasing at an annual rate of 1 ppm. “That is 200 times faster than anything seen in the past. No doubt about it: We are currently experimenting with our Earth’s system, and the outcome is totally unknown”, says Notholt. And he calls that “nothing really spectacular”!


